If you’ve tried my Android depth camera Processing code you may be wondering how to go about using OpenCV to detect things like markers. You may even be wondering how to detect a checkerboard pattern for calibrating your depth camera outputs. Obviously one way to do that is to take a normal RGB photo at the same time, then work out how to align it with the depth data. But, have you wondered what the confidence values are in the depth data? Well, they mostly represent how much of the infrared light pulse is reflected back from the target to the time-of-flight sensor. So, they are heavily influenced by dark and light surfaces, which we can use to our advantage.
So firstly, how do we get the confidence values in a useful way. Well, if you use the code on the Parth3D Github repo it’s quite easy. Here I’ll use Python3 as an example, but you should be able to do something similar based on the Processing/Java and P5JS/Javascript libraries in the repo. In Python you can use the code below with a file saved by the Processing/APDE Android code. It opens the file, gets the confidence data and uses it to create an image that basically represents the reflectivity of the scene.
from depthcamera import loader as ldr
from depthcamera import imagemaker as imk
from matplotlib import pyplot as plt
ok = ldr.load_file("mydepthfile.dcam")
confr = ldr.get_depth_confidence()
conim = imk.make_confidence_image(confr, 1)
conim.save("myconfidenceimage.png", quality = 95)
fig = plt.figure()
plt.imshow(conim, cmap = 'gray', aspect = 'equal')
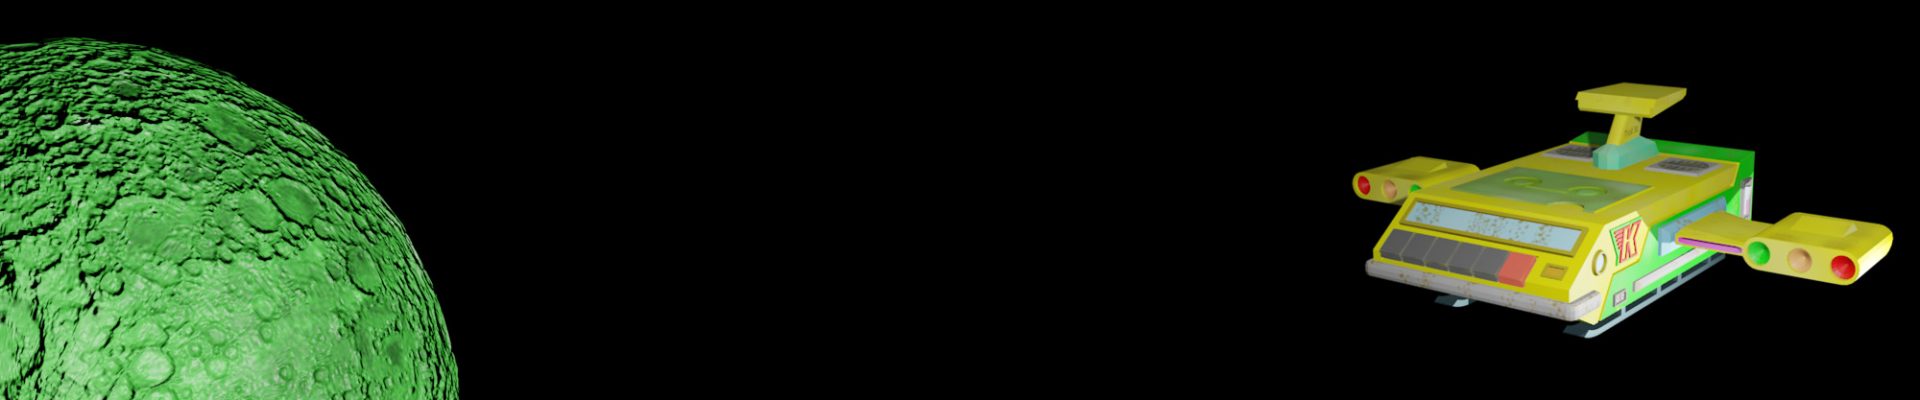
plt.show()As an example, I tried a depth camera file I took of a sheet of 10mm diameter adhesive 3D scanning markers. They’re designed to give a good contrast in reflectivity, with a very reflective white circle in the middle and a black low-reflectivity border. As you can see in the confidence image below they show up very well. The low confidence values are black and represent low levels of reflection. The white areas are those which reflected much more of the time-of-flight camera’s light pulse. And red areas basically have zero confidence and so need to be ignored.

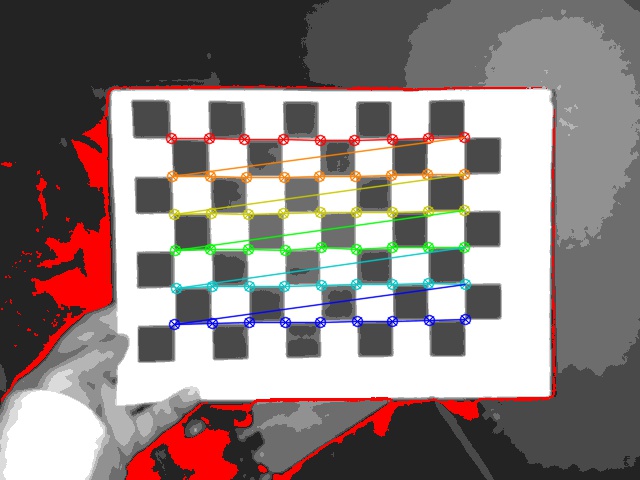
Next up I thought I’d show how to detect a checkerboard pattern, such as the ones used with OpenCV for camera calibration. However, I should say that Android depth camera data seems to be undistorted by default, so probably don’t need calibration for most uses. The image below shows confidence values for a checkerboard I’m holding in my hand. And I’ve used OpenCV to detect and draw the squares, so you can see how well it works with the confidence image. The trick is to use paper that gives good contrast, so shiny thermal-printer paper is out. Personally I’ve found laser printers, with plain paper, work best.
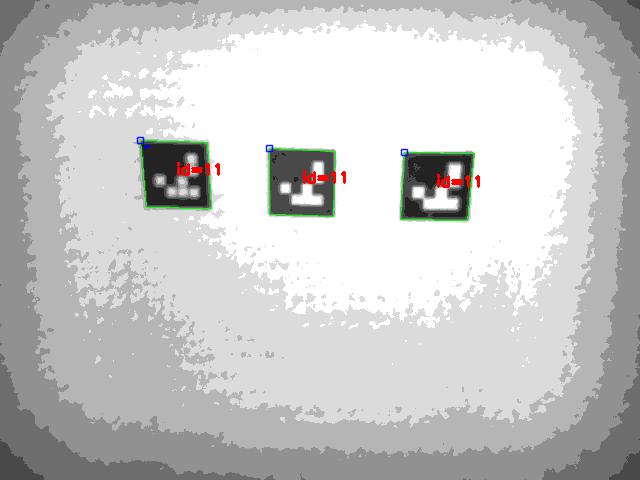
Now let’s look at using confidence data to detect Aruco markers. Obviously you could just make some markers with a laser or inkjet printer, but if you read my earlier post about 3D printing Aruco markers you may wonder whether they would work too. Well, yes they do, assuming you use a dark, rough, material. In the image below I used black PLA and used the side in contact with the print bed to get a good finish. As you can see, not only did the markers show up in the confidence image, but also OpenCV was able to identify the marker ID.
And that’s it for this post. I hope I’ve convinced you that confidence data from time-of-flight cameras can be put to good use detecting things like markers and calibration patterns 🙂


