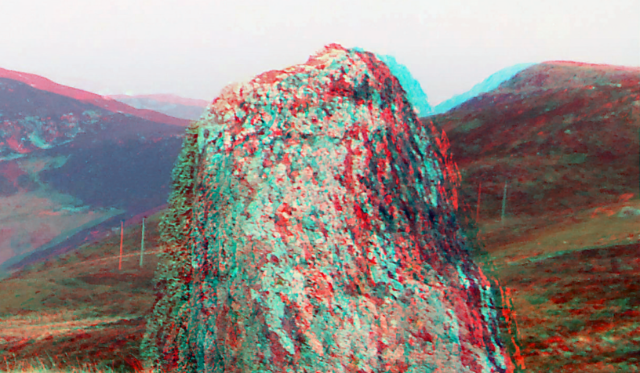
In case you don’t know, anaglyphs are 3D images created from two views, seperated by a small distance, using different colours for the left and right. I’ve put an image of a zoomed in section of an anaglyph below, so you can see what I mean. You’ll probably have seen them when you were younger, with red/cyan glasses attached to comic books or magazines that had 3D content. According to Wikipedia, they’ve been around since at least 1853, yet these days they’ve become largely redundant due to the rise in other formats, arguably the most important being side-by-side (SBS) images. That’s not surprising as anaglyphs essentially throw away much of the colour information for each view, meaning converting to a 2D image is very difficult, if not impossible.
But, anaglyphs have an important advantage over side-by-side images: the glasses are much easier to carry than a 3D television, a 3D monitor, or a virtual reality headset. Also, the glasses are often very inexpensive and made of cardboard with thin coloured plastic to cover each eye. So if you want to share your 3D photo masterpieces with friends and relatives on the other side of the world, anaglyphs can be a good format. And, anyway, what’s wrong with enjoying a good old-fashioned retro 3D viewing method! So I thought I’d write a post to share how I go about converting SBS to anaglyph in Python 3.
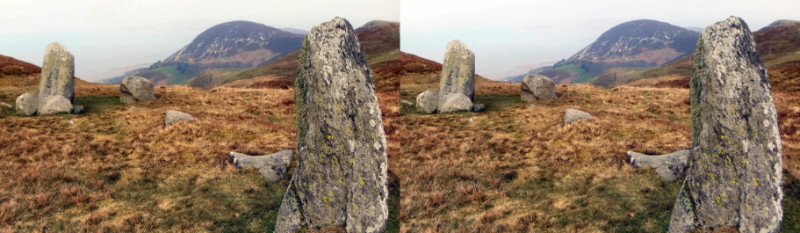
If you don’t have one already, you’ll obviously need a 3D SBS image (left view on the left) to convert. In that case you can just use the example one I’ve included in the Parth3D Github repo, where you can also download the example code if you don’t want to copy and paste. Below is a reduced size version which you can download instead if you prefer, but the one on Github is a higher resolution so good for viewing on larger monitors. It’s a view I photographed in 2014 of some stones at the amazing neolithic Meini Hirion (in English, Druids Circle) in the mountains above Penmaenmawr in North Wales.
To carry out the conversion in Python 3 we will use the Python Imaging Library, specifically using Pillow. You may find you already have it installed as a dependency for another library, but if not you can easily install it using Pip and PyPi. And if you want to do this on an Android phone or tablet, as I did, you can even install it in PyDroid3 (which also works on Chromebooks with Android support). Then we can import the library in our Python IDE, or PyDroid3, load the SBS image and get the dimensions of the photograph (which I’ve named ‘druidscircle.jpg’).
from PIL import Image

sbs = Image.open("druidscircle.jpg")
sbsw, sbsh = sbs.size
The Pillow Image module has now loaded the SBS image, and we’ve used ‘size’ to get the width and height of it, in pixel units. Knowing the size we can now create a new, blank, image to draw the anaglyph onto. Obviously, that new image will be the same height as the SBS one, but only half as wide. Here’s how we do that.
aglw = int(sbsw/2)
agl = Image.new("RGBA",(aglw,sbsh),(255,255,255,255))
I used int(sbsw/2) just in case the SBS image had a width with an odd number of pixels, which would confuse Pillow. However, it’s very unlikely that you’ll find an SBS image with an odd-pixel width, as the two views are generally the same size. But, best to be careful in my humble opinion. Anyway, having done that we need to be able to access the pixels of the SBS image to get pixel colours, and similarly of the new anaglyph image for drawing it. That’s easy with pillow, and here’s how.
sbspix = sbs.load()
aglpix = agl.load()
The two pixel objects we now have can be considered simply as lists (a.k.a. arrays) containing lots of red/green/blue value lists, one for each pixel. So, we can now iterate through all of the pixels in the left and right views and work out what colour to make the corresponding anaglyph pixel. I’m using red/cyan glasses which are the most common ones and easily bought on sites like eBay and Amazon quite cheaply. If you look at your pair you’ll see the red side is on the left and cyan (i.e. green and blue) on the right. So all we need to do is take the red value from the left view, and the green and blue from the right view, and mix them into the anaglyph colour. Here’s how to do that (it may take a few seconds if you used the high-resolution SBS image).
for y in range(0, sbsh):
    for x in range(0, aglw):
        left = sbspix[x, y]
        right = sbspix[aglw + x, y]
        aglpix[x, y] = (left[0], right[1], right[2])
As you probably expected (if you’re a coder) that was really quite easy. The right pixel in the SBS image is offset by the width of the anaglyph (i.e. half the SBS width) so getting the left and right pixels is easy. Also, as we’re simply using list notation, we were easily able to set the red, green and blue values for the anaglyph pixel. And now you have an anaglyph image you’re likely to want to save it to a file. It’s best to do that now, as I’ve found that doing so after plotting the image can prevent bytes being written to the image file (at least, that’s what happened to me on PyDroid3). So this line of code will do that.
agl.save("anaglyph.png")Of course, there are other ways to save the image if you’re an experienced coder, but for this example the Pillow way works well and you should now have an image file in your code folder. However, it’s nice to display the outcomes of the code in Matplotlib too, so here’s some code to do that, which you can append to the end of your code file.
from matplotlib import pyplot as plt
plt.imshow(agl)
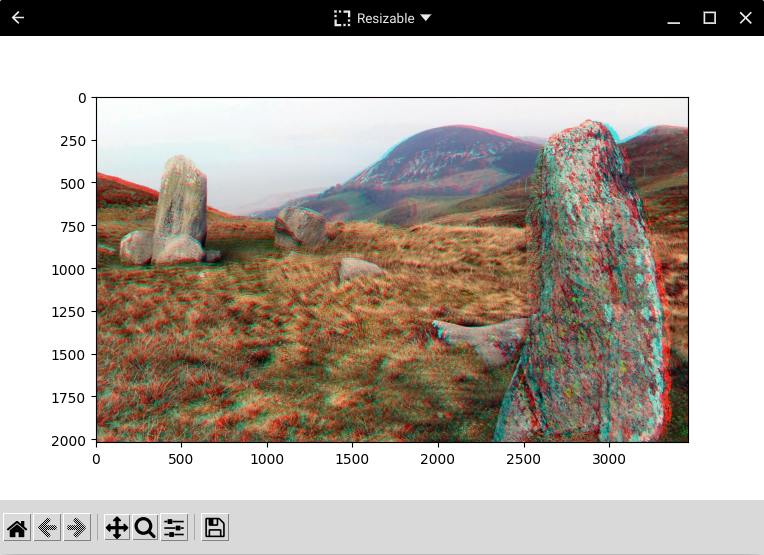
plt.show()So just three lines of code and we get the anaglyph plotted in a matplotlib window like the one below. I used PyDroid3 on my Chromebook to run the code, which worked well, and I think it’s very useful to be able to run the code with photos on my Android devices.
And that’s all there is to converting SBS images to anaglyphs in Python 3! However, this is just a basic example and you’ll likely need to add to the code for many uses. For example, SBS images with bright areas of primary colours can make the anaglyph confusing to view, so you may want to add the ability to convert the SBS image to monochrome (a.k.a. black and white or greyscale). And some SBS images confusingly have the right view on the left, in which case the anaglyph will look odd and you can easily change the code to swap the left and right pixels. Plus, with a little work, 3D images with the views above and below each other can be accommodated with small changes to the code. But, regardless of how you use the code, I hope you enjoyed this post 🙂


