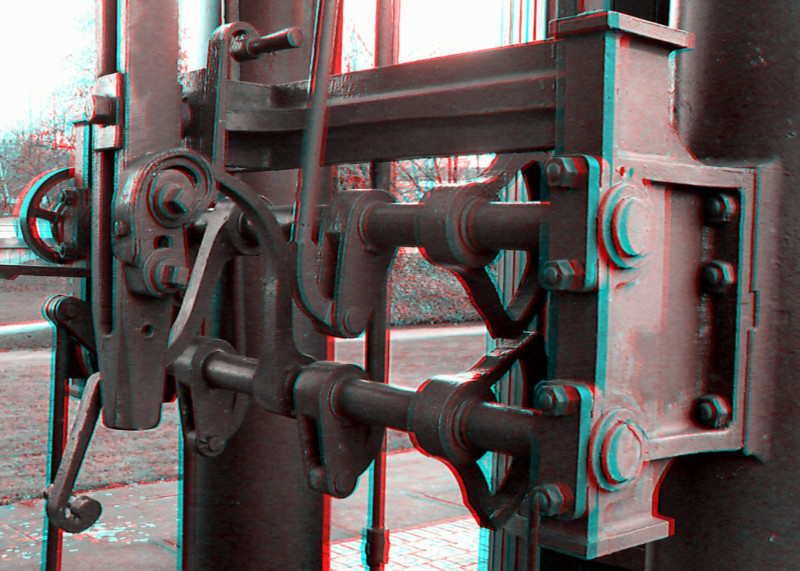
Recently I wrote a post about how to make anaglyph images from side-by-side (SBS) photos. That’s useful if we want to easily share our 3D imagery, but what if we already have an old anaglyph-only photo and want to access the SBS views? As an example, we may want to view them on a 3D screen, or even use them to get depth data from a disparity map in OpenCV. So I thought I’d write a post to share a basic example of how I do it in Python using the Pillow image library. To do that we need an anaglyph, so below is one I took in 2011 of part of the old Grazebrook beam engine at Dartmouth Circus in north Birmingham (the one in the UK). I’ve reduced the size to display here, but you can get the full size version I used on the Github repo, together with the code if you don’t want to copy and paste.
The first thing to note about this simple experiment is that creating anaglyphs essentially throws away half of the colour information. That’s because only the red channel on the left, and the green/blue channels on the right, are taken from the two views (assuming you’re using a standard red/cyan anaglyph, otherwise the colour channels may differ). So we’re just going to create a monochrome SBS image from our anaglyph (which is monochrome anyway) for now, simply to see how well it turns out. So to begin, we’ll need our Python IDE (or an app like PyDroid3 on Android) set up with the Python Pillow library installed, plus Matplotlib for displaying the resulting SBS. Then we can import the libraries into our code.
from PIL import Image
from matplotlib import pyplot as plt
Now that Pillow is imported we can use it to load the anaglyph image. The code I used is below and simply loads an image file named through the fn parameter. The function also has a maxwid parameter which is there to make it easy to reduce the size of large images if we want to. We only specify the maximum width as the code automatically works out the height from the aspect ratio of the raw image. The code also changes the colour mode of the image to three channels (red, green and blue) as using a mode that allows an alpha (transparency) value would complicate the later code.
def load_image(fn, maxwid=None):
    pim = Image.open(fn)
    if maxwid != None:
        w, h = pim.size
        if w > maxwid:
            asp = w / h
            nh = int(maxwid / asp)
            pim = pim.resize((maxwid, nh), Image.ANTIALIAS)
    if pim.mode == "RGBA":
        pim = pim.convert('RGB')
    return pim
With the image loaded we can now get on with extracting the left (red) and right (green/blue) channels, from the anaglyph, using the code below. To do that we first create new images for the two views, which need to be the same size as the anaglyph. We could simply draw the views directly to SBS, but I decided to create seperate images to allow independant Pillow enhancements (e.g. brightness and contrast) before combining them. Creating the two views is just a case of using the corresponding left and right colours as brightness values for a new monochrome colour. By default the code averages the green and blue values from the right channel. However, the code can be used to create the right view from only the green or blue, using the gbmode parameter, if you prefer.
def split_anaglyph(ang, gbmode="av"):
    aglw, aglh = ang.size
    lim = Image.new("RGB", (aglw, aglh), (255,255,255))
    rim = Image.new("RGB", (aglw, aglh), (255,255,255))
    apix = ang.load()
    lpix = lim.load()
    rpix = rim.load()
    for y in range(0, aglh):
        for x in range(0, aglw):
            col = apix[x, y]
            lc = int(col[0])
            lpix[x, y] = (lc, lc, lc)
            if gbmode == "green":
                rc = int(col[1])
            elif gbmode == "blue":
                rc = int(col[2])
            else:
                rc = int((col[1] + col[2]) /2)
            rpix[x, y] = (rc, rc, rc)
    return [lim, rim]
The split_anaglyph function returns two monochrome images, one for the left view and one for the right. But we want SBS, so we use the function below to create a new image. It basically creates a new image twice as wide as the left view, then pastes the left and right views onto it. It’s very simple to do using the Pillow library.
def make_sbs(lim, rim):
    # Both images must be same size!
    w, h = lim.size
    sbsim = Image.new("RGB",(w*2, h), (0,0,0))
    sbsim.paste(lim, (0,0))
    sbsim.paste(rim, (w,0))
    return sbsim
Now, having received a SBS image from the make_sbs function, we could save it to a file using Pillow. But for now let’s just view it using Matplotlib. We can use the code below for that which is enclosed in a main function so we can use our code as a simple Python library too. The code is quite simple, it just uses the functions above to load the anaglyph, split it into left/right view images, and combine them into a SBS image which we display in all its’ glory in a Matplotlib plot. And if you want to modify the code to enhance the two views using Pillow, or your own code, just insert your extra code just before the make_sbs function call.
if __name__ == '__main__':
agl = load_image("enginepart.jpg", 640)
left, right = split_anaglyph(agl)
sbs = make_sbs(left, right)
plt.imshow(sbs)
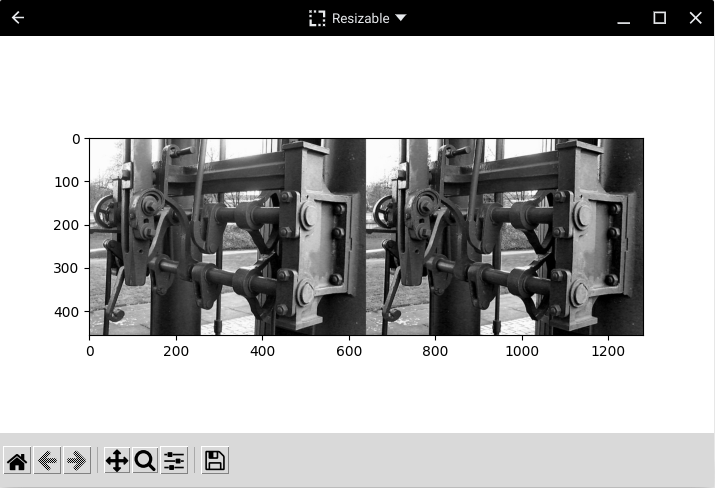
plt.show()Below is a screenshot of the SBS image in Matplotlib on my Chromebook, using the excellent PyDroid3 Android app. Fortunately the images I used for the anaglyph didn’t have large areas of a primary colour: even the sky was cloudy and grey. However, you can see that the SBS image has areas where one view is darker or lighter than the other. And that’s the main challenge we face with this kind of conversion: large areas of primary colour will be darker in one of the views. If you have some other anaglyphs to try you’ll likely find the results vary dramatically depending on the dominance of primary colours. But for more balanced anaglyphs we can get some useful results, as with my photo here.
And that’s all there is to creating a SBS image from an anaglyph photo. Of course, it’s not amazing all-encompassing code that produces lovely full-colour SBS images, but it does give a starting point for more adventurous exploration of 3D image conversions from anaglyphs in Python 🙂


